

There is nothing that prompts more disagreement or debate in the Magic community than the Banned and Restricted List. Ask 10 people their opinions, and you’ll get half a dozen different answers, or more. There are several reasons for this.
First, different people have different concerns or priorities when it comes to Banned and Restricted List management. This does not mean that there is no agreement or overlap in opinions among players. Often, there is substantial overlap. But even slightly different priorities can lead to wildly different conclusions. Consider the following factors, which I have found to be among the most frequently raised among players in the Vintage community:
• Format diversity – meaning the range and spectrum of decks that exist, both in terms of strategic orientation and color diversity.
• Format balance – the degree to which one or a few decks dominate the metagame, either in terms of representation or in terms of win rates.
• Interactivity – the subjective quality of game play, and degree of counterplay that exists in a format.
I would note that the official Banned and Restricted List web page maintained by Wizards of the Coast specifically emphasizes “diversity” as the reason that a “system of banned and restricted lists has been developed.” As they explain there, “One key to the continued health of Magic is diversity. It is vitally important to ensure that there are multiple competitive decks for the tournament player to choose from.” Although this explanation implicitly connects format diversity and format balance, the absence of other explicitly provided reasons for banning and restriction does not mean that there are no other grounds for doing so.
There are other factors that make a format ‘healthy,’ ‘good,’ or ‘fun,’ but even if two players agreed that these three were the most important factors that shape management of the format’s Banned and Restricted List, minor differences in how those players rank order or prioritize these concerns can lead to starkly different conclusions. Putting one factor over another can lead to completely different conclusions about how the format should be managed, even if two players agreed that they both matter. Their relative importance can be decisive.
Second, players’ perspectives on the format, based on either their longevity or experience in the format, and their preferred deck choices, dramatically inform their views on the aforementioned factors. So, for example, if you are a player that is a Mishra’s Workshop specialist (aka an O’Brien School master or adherent), then you will have a very different perspective on the quality of game play fostered by Paradoxical Outcome than if you were a Xerox pilot (or a Comer School master or adherent). As a Workshop specialist, the PO matchup probably feels far less interactive and one-sided than it does for a Xerox pilot.
Likewise, if you have been playing Vintage since 2004 your tolerance for decks like Paradoxical Outcome (PO), big mana blue decks with bombs like Tinker, Yawgmoth’s Will, and Time Vault/Voltaic Key, is likely to be greater than if you started playing since 2012, where those decks have largely been absent from the format (until the rise of PO decks). The mid-late Oughts (2004-2010) had many decks like that, and even faster and more broken decks, such as The Perfect Storm (TPS) and Grim Long. Those decks are comparatively marginalized in the current format, and thus, when they see play, they may seem beyond the bounds of Vintage brokenness, if your view of Vintage is based on 2012 and more recently.
Thus, a player’s length of engagement with the format, archetype or strategic preferences, and experience of particular matchups, likely will shape that player’s view of even basic issues, like whether games are interactive or not or gameplay is tolerable (as they will have likely lived and played through more historical formats, and the ups and downs that have gone with them).
Unfortunately, there is no metric or measure that could solve this problem. But there is a metric that can provide a holistic view of the balance and diversity of the format. In this article I will review existing measures of metagame quality, introduce a new measure, and illustrate what this measure suggests about the evolving Vintage metagame.
An Overview of Vintage Metagame Measures
For most of the history of Vintage, the only consistent and objective metric that Vintage analysts had to evaluate the quality of the format was tournament Top 8 appearances. In the absence of detailed tournament data, we looked at aggregate Top 8 results across the globe to construct a portrait of the metagame. Here is an example of an article I wrote in 2010 than does exactly that. The article describes each major strategy in the format as a percentage of Top 8s, and then describes the contours of the overall metagame. Phil Stanton, Matt Elias, I, and others have written plenty of articles over the past two decades doing exactly this.
For specific tournaments for which we had a complete metagame breakdown, we could go deeper, and examine the relative performance of decks in the metagame. For example, I was given the 2000+ lists from a Grand Prix held in Madrid, and was able to calculate the Day 2 conversion rates for each archetype, as well as the percentage of each that converted to Top 64, 32, 16 and so forth. I was able to do that with final standings and a complete metagame breakdown, in the absence of actual match data.
However, with the advent of Vintage on Magic Online, and with more detailed match results, it is possible to crunch much more detailed numbers. After all, Top 8 appearances are just a function of the representation of decks in the field and win percentages. In that sense, Top 8 appearances is indirectly, but imperfectly, indicative of archetype win percentages. Without detailed match results by round, we can’t actually calculate win percentages directly, as I did for a Vintage Challenge in mid-October.
The problem, however, is that calculating win rates is very labor intensive, and except for large events like the North American Vintage Championship, which Ryan Eberhart and Matthew Murray crunched, no one is currently doing it on a monthly basis for the Magic Online Vintage Challenges.
There seems to be consensus that deck and/or archetype win rates/win percentages is the best measure of format balance, at least as far as sussing out if a deck is dominating the Vintage format. Among the close observers of the format, and especially those handling or monitoring empirical data, win percentage rates are viewed as the best performance metric, as long as it is examined over time and with sufficiently large sample sizes. A number of more recent Banned and Restricted List announcements, with more detailed data analysis than has been traditionally presented, have focused on win rates, and seem to be using win rates to evaluate format balance.
As valuable as win rates are, it is not a data point we have for most tournaments or most periods. As useful as knowing individual deck win rates are, win rates have another limitation: they can’t tell you how diverse a metagame is. We can posit that a format where no deck has a win rate above 52% may seem balanced, but balance is not the same thing as diversity.
A format could be very balanced, but very small and insular. Rock, Paper, Scissors is a very balanced, but limited metagame. Win rates matter, but they can’t tell us everything we might want to know about the health of a metagame. In fact, alone they tell us almost nothing about the composition of the metagame. Just as Top 8 appearances don’t tell us everything we might want to know. Each measure or perspective is a partial view, concealing while also revealing some aspect of the format.
The Gini-Simpson Diversity Index
With that background out of the way, and with those caveats presented, I began to hunt for a measure that could evaluate could measure ‘metagame inequality,’ much like the Gini Coefficient measures income inequality. But I also wanted it to be sensitive to the presence and performance of multiple archetypes. And since we lack consistent win percentage data, it couldn’t be based on that. In short, I wanted a formula that could detect, and scale, a metagame that is more diverse and balanced, and one that is less diverse and more imbalanced.
To put it in concrete terms, I wanted a formula that could distinguish between these two metagames.
Balanced & Diverse Metagame (Percentage of Top 8s):
Deck 1: 17%
Deck 2: 16%
Deck 3: 15%
Deck 4: 12%
Deck 5: 11%
Deck 6: 8%
Deck 7: 7%
Decks 8-11: under 5%
Imbalanced, and Non-Diverse Metagame (Percentage of Top 8s):
Deck 1: 40%
Deck 2: 30%
Decks 3-11: Under 5%
This “Imbalanced, and Non-Diverse Metagame” is not actually a hypothetical – it was the metagame in the summer of 2017, as described by the DCI. In short, I needed a formula that could detect and strongly represent the differences between those metagames, and give me a scaling value.
At first, I thought I might have to create my own “mashup” Index that incorporated two different indicators. For example, I thought I might need one indicator that functioned like the Gini Coefficient, and measured inequality between archetypes, and another indicator that could detect the number, range or abundance of strategies in the metagame. But someone directed me to a formula that did exactly what I was looking for: The Simpson Diversity Index.
Used in ecology to measure the diversity of a habitat, what makes this Index so perfect is that it captures both of the elements I was looking to incorporate. It is sensitive to both “richness,” meaning the number of species in the environment, and “evenness,” the relative abundance of species to each other. I quickly learned the formula (which is actually fairly simple), and used an online calculator to test some extreme, hypothetical metagames.
For my first test, I entered a 5 deck metagame, with one deck having 1000 Top 8 appearances, and the other decks with just 1 Top 8 appearance a piece, and the value was basically .99. And then I put in a 10 deck metagame, with every deck having 2 or 3 Top 8 appearances, and the score was 0.067.1 I then went ahead and began calculating this score for a variety of Vintage metagame data that I had already collected, and the results were very interesting.
Diversity Index Scores for the Vintage Challenges
Because I maintain a spreadsheet that has Top 8 results for every Vintage Challenge on Magic Online, it was very easy for me to input that data into the online calculator and get Gini-Simpson values for every month. After doing this a few times, I even figured out how to automate the formula within excel (since the formula is pretty simple – see the endnote at the bottom of this article to see it).
Rather than present everything at once, let me begin by telling you the scores I first found. Recall that a higher value indicates a more balanced and more diverse metagame, and a lower number indicates a less balanced and less diverse metagame, with .99 being a nearly perfectly balanced and diverse metagame with a plethora of viable decks, and a value closer to 0 being a metagame dominated basically by a single deck. After running just the numbers for 2018, here were my first results:
| 2018 Vintage Challenges | 18-Jan | 18-Feb | 18-Mar | 18-Apr | 18-May | 18-Jun | 18-Jul | 18-Aug | 18-Sep | 18-Oct |
|---|---|---|---|---|---|---|---|---|---|---|
| Gini-Simpson Score | 0.84 | 0.8655 | 0.79 | 0.8367 | 0.8831 | 0.8821 | 0.8427 | 0.8387 | 0.8179 | 0.8911 |
To put these numbers in perspective, recall that the hypothetical 10 deck metagame where every deck had 2 or 3 Top 8 appearances would give you a score of .93. That’s about as balanced as you can possibly get in a Vintage format. Every Vintage Challenge result has 8 decks in the Top 8 results, and therefore every month of Vintage Challenges has either 32 or 40 decks, depending on whether there were four or five Challenges that month (which depends on how many Saturdays were in the month).
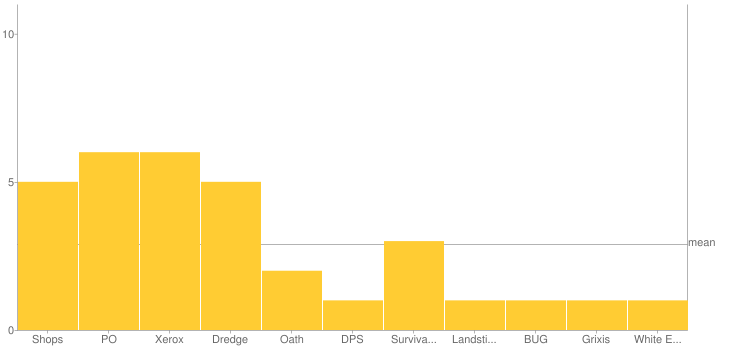
Given that .93 is pretty close to a ceiling value, what this shows is that 2018 was a very healthy year for the Vintage format, according to this Index measuring the Vintage Challenge results. The best month of the year, according to this measure, was October 2018, which had a nearly .90 value, and the next best month was in June. But there was only one month the entire year where a value was below .80 (March, as you can see in the table above). This suggests that the Vintage metagame was pretty balanced and diverse in 2018, with few decks dominating and a very diverse set of decks making Top 8. To see this in more detail, take a look at the online calculator results for October 2018.
You can scroll down that page to the histograms at the bottom to see the actual spread of decks by incidence, as pictured here:
So, I obviously wondered how the 2017 Vintage Challenge results would compare with 2018. So I ran that data as well. Here were the results:
| 2017 Vintage Challenges | 17-Jun | 17-Jul | 17-Aug | 17-Sep | 17-Oct | 17-Nov | 17-Dec |
|---|---|---|---|---|---|---|---|
| Gini-Simpson Score | 0.7742 | 0.6962 | 0.6895 | 0.7654 | 0.8891 | 0.8226 | 0.8013 |
These numbers come in significantly lower than the values for 2018, showing a less diverse and less balanced Vintage metagame in 2017. As you can see, most of the months in 2017 here have Gini-Simpson scores below .80, and some even below .70. In fact, the two months leading up to the restrictions of Monastery Mentor and Thorn of Amethyst are the worst in the entire data set. But we would expect that. After all, these cards were restricted after the DCI observed that they accounted for 40% and 30% of Top 8s, respectively.
As Wizards wrote then, “Recently, both the paper and Magic Online Vintage metagames have been in an unhealthy place due to the prevalence and performance of two decks: Shops and Mentor. Data from twelve recent Vintage Challenges reinforces this, with 40% of the Top 8 decks being Shops and 30% being Mentor.”
The Gini-Simpson scores bear this out, with the two lowest values in the data set. But look at what happens after Mentor and Thorn are restricted: the scores begin increasing and improving again.
The reason the table starts in June is because the first Vintage Challenges were in May (there were only two in May – the predecessor event, the Power Nine Challenge ran monthly from October 2015 through April 2017).
I wondered if I should or could go back even further, and compile the MTGO Power Nine Challenge results to get a relatively comparable score. The problem is that the Power Nine Challenges were monthly, resulting in a data set of only 8 decks per month. I decided to aggregate them into quarters, which gives us 24 decks per period, for 2015 Q4, 2016 Q1, 2016 Q2, 2016 Q3, 2016 Q4, and 2017 Q1+April. The results seemed comparable. Here they are:
| Vintage/P9 Challenges | 2015 Q4 | 2016 Q1 | 2016 Q2 | 2016 Q3 | 2016 Q4 | 2017 Q1+April |
|---|---|---|---|---|---|---|
| Gini-Simpson Score | 0.8732 | 0.8043 | 0.837 | 0.8804 | 0.7754 | 0.8286 |
This is quite interesting: Recall that 2015 Q4 was immediately after the restrictions of Chalice of the Void and Dig Through Time, which took effect on September 28 2015. Thus, the 2015 Q4 results show a very healthy metagame. That begins to recess somewhat, and then Lodestone Golem was restricted on April 4 2016. The metagame following Lodestone’s restriction is somewhat healthier, getting better by the 2016 Q3, but then becomes more imbalanced and less diverse the next quarter, before rebounding 2017 Q1+April, which is when Gush and Gitaxian Probe were restricted on April 24 2017. The remainder of 2017 is pictured above, when the format goes into a tailspin.
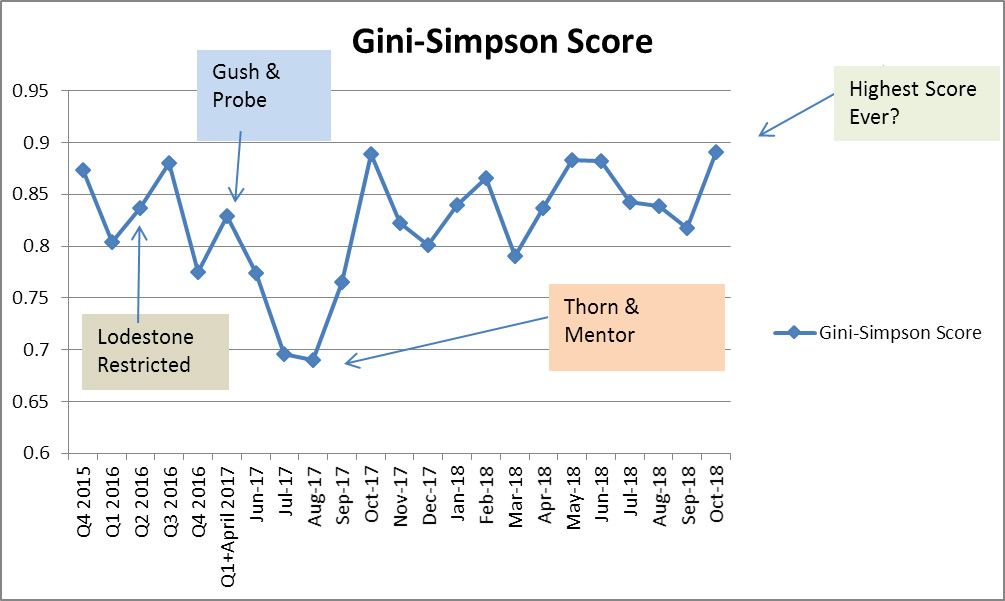
Overview of Vintage from October 2015 Through October 2018
The following chart shows all of this data at a glance. As you can see, the most imbalanced and least diverse metagame of the last three years was the summer of 2017. The most diverse and balanced appear to be the last year, from October 2017 through October 2018, with the highest Index score in the period coming in October 2018.
Now, obviously there are limitations to what this Index can tell us. It can’t tell us if players are having fun, or if the games are interesting and skill intensive (which are their own debates). But it does tell us something useful about the diversity and balance in the Vintage format at the moment. It’s not the only story or even the final story, but it is a helpful one.
Conclusion
Given the availability of data that can be used to evaluate the quality of Magic metagames, I would like to see more indices like the Gini-Simpson Index being applied to study not only Vintage, but other competitive Magic metagames. Given the fact that Magic Online Challenge results and similar, regularly posted results are available for other formats, it should be relatively easy to plug aggregate results into the Gini-Simpson formula to evaluate the health of other formats. I also hope that this article may inspire readers to search for other formulas or measures that can give us an even better portrait of Magic metagames. These tools can may help us better understand the dynamics of the formats they are focused on, and help format managers evaluate the quality of a given format when compared against its own historical record.
Until next time,
Stephen Menendian
Endnotes
1 As a methodological note: I initially calculated just Simpson Index scores, but because of the way that the formula is calculated, the results are counter-intuitive: it gives healthier metagames a lower value, and more imbalanced and less diverse metagames a higher value. Take a look at the online calculator results from August 2018 Vintage Challenges here. The Simpson Index value is .1613, which is relatively low on a 0-1 scale. But online calculator also gives you the Gini-Simpson value (which it calls the “dominance index,” which is nothing more than 1 minus the Simpson Index value. This creates a more intuitive result that matches a higher value with a “better” metagame. The mathematical difference is the difference between this formula:
![]()
and this one:
![]()