

Some years ago, a few friends and I had a conversation about a quintessential Magic question: “How many one-drops should I play in my aggro deck?”
It’s a deceptively simple question, and the answer is both complex and subjective. The number we agreed upon in the moment was at least nine one-drops, because it corresponds to slightly better than 1-in-7 odds. But what percentage of starting hands will contain a one-drop and will we be satisfied with the result?
There are two methods at our disposal to determine a more satisfactory answer: trial-and-error, and statistical modeling. Most players interested in deck-building approach the task using trial-and-error, but it is time-consuming. Statistics, however, is an incredibly powerful and under-utilized tool in the context of card games. With a bit of experience, we can answer complicated questions without spending the time required for trial-and-error.
I’ve written a Mathematica CDF that will do the computations, available for download here. You will need the free CDF viewer, available for download here. I suggest downloading the CDF before continuing with the remainder of this article. I will reference it periodically and quote probabilities that can be calculated using the CDF.
Simple Statistics
The statistics of drawing cards from a deck, without replacing them before drawing the next card, is exactly modeled by the hypergeometric probability distribution. The simplest hypergeometric distribution describes the probability of drawing k successes in n total draws from a population of total size N containing exactly K successes. This is often written in terms of binomial coefficients as:
This is most easily interpreted as “N choose n” – i.e. the number of different possible combinations of n objects drawn from a population of total size N.
The top of the fraction gives the total number of different possible samples of n draws that contain k successes, while the bottom of the fraction gives the total number of different possible samples of n draws. The result is the probability of drawing exactly k successes in n draws.
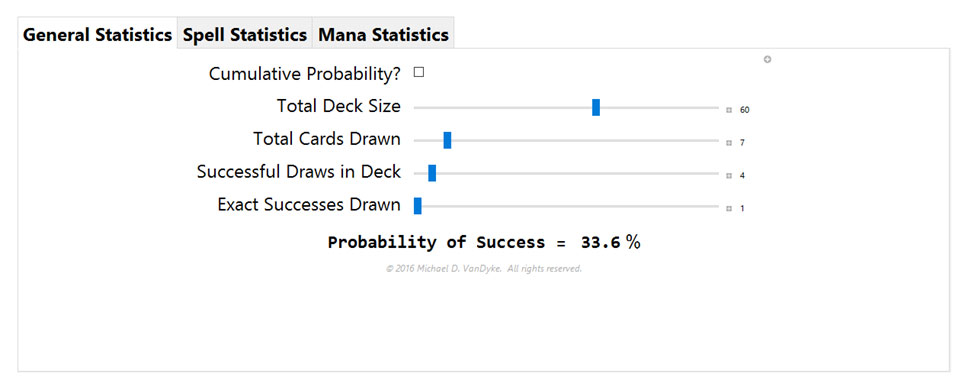
For example, let’s say we wish to know the likelihood of drawing exactly one Force of Will in our starting hand of seven cards from a 60-card deck containing four Force of Wills. The CDF will calculate this for you on the “General Statistics” tab with the “Cumulative Probability?” checkbox unchecked.
P (1,7,4,60) = 33.6%
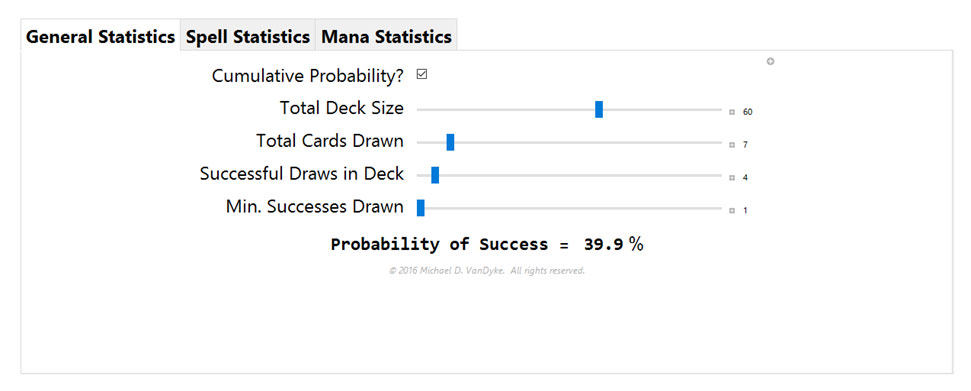
A more useful probability is the likelihood of drawing at least one Force of Will in our starting hand. Again, the CDF will calculate this for you on the “General Statistics” tab, but this time with the “Cumulative Probability?” checkbox checked. This corresponds to the oft-quoted 40% likelihood:
P (1,7,4,60) + P (2,7,4,60) + P (3,7,4,60) + P (4,7,4,60) = 39.9%
Returning to our initial question, if our deck contains nine one-drops, what percentage of seven-card starting hands would contain at least one one-drop? The answer is 70.0% and this can be verified by using the CDF.

Whether this is acceptable to you is completely subjective! Personally, a probability closer to 90% is preferable when winning the game will likely hinge on whether we play a one-drop.
The only problem with what we’ve done so far is that, in practice, we don’t keep all possible starting hands. This means that many hands are not statistically relevant (since we would mulligan them anyway) and, thus, many probabilities can’t be calculated using such simple statistics.
More Useful Probabilities
To answer more complicated questions, we’ll need to make the underlying statistical distribution more applicable. The multivariate hypergeometric distribution describes the probabilities of drawing from a deck made of any number of different classifications of cards.
If we phrase this in Magic terms, we can better grasp its meaning and possible uses. For instance, we might say our deck contains mana sources, 1-mana spells, and other spells (that don’t cost 1 mana). This is how the “Spell Statistics” tab of the CDF categorizes the cards in a deck. We’ll use it to determine how many of a certain type of spell we should play in our deck.
Alternatively, we might say our deck contains “successful” mana sources, other mana sources, “successful” spells, and other spells. This is how the “Mana Statistics” tab of the CDF categorizes the cards in a deck. We’ll use this tab to determine how many lands of a certain type we should play, given the number of spells with a specific mana requirement and a turn on which we wish to play them.
Spell Statistics
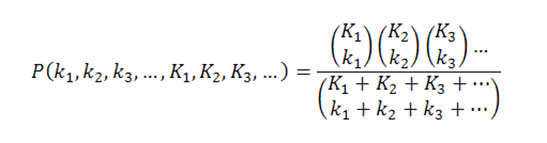
Let’s return to our initial question, but amend it to be more exact. First, let’s define the contents of our deck in more detail. Many 60-card aggro decks have 21 mana sources, and for good reason. This corresponds to an 85.0% probability (on the play) or 89.8% probability (on the draw) of having two lands by turn two.
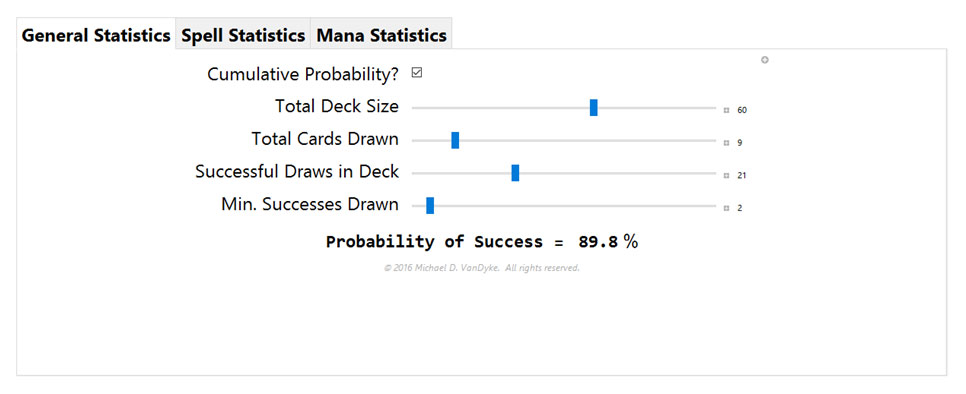
Assuming we have a 60-card aggro deck containing 21 mana sources, how many one-drops should we play if we want to have at least one in 90% of keepable seven-card starting hands? A keepable hand is also subjective, but we’ll assume we only wish to keep hands with between two and four mana sources.
Calculating this using the “Spell Statistics” tab in the CDF, we find that we should play at least fifteen one-drops (90.9%) to meet our requirements.
Mana Statistics
Most discussions on the building of a mana base are incorrect. With few exceptions, one of the two necessary elements in answering any question regarding mana is missing:
(1) How many spells in our deck have a certain mana requirement?
(2) On what turn do we wish to cast these spells?
For example, many recent statistical analyses of mana bases, such as Frank Karsten’s article, assume a large value for (1), as a matter of practicality. An example a bit closer to home is watching someone build a mana base for their booster draft deck by simply counting mana symbols, essentially ignoring (2).
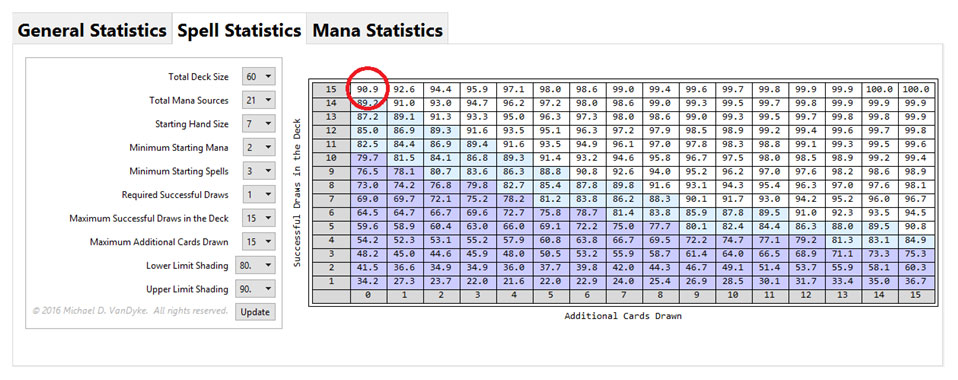
So how can we answer our mana question correctly? Let’s say, for the sake of argument, that all fifteen one-drops require red mana to cast. The next question to ask ourselves is:
“How many untapped red sources are needed if we want to be able to cast a one-drop 90% or more of the time in our keepable hands that also contain a one-drop?”
The answer is eleven untapped red sources (91.2%). Eleven sources may seem low. However, we intend to mulligan any hand with fewer than two lands. We haven’t considered that we probably want to consistently cast a two-mana spell on turn two, as well. That would increase the number of untapped red sources too.
Additional Working Examples
Here’s a series of additional questions that can be answered using the CDF. Calculating the answer with the CDF is left as an exercise. In each case, assume our deck contains 60 cards, our starting hand is seven cards, we mulligan hands with fewer than two mana sources or fewer than three spells, and that we’re on the play, unless specified otherwise.
“Our Legacy Grixis Delver deck contains four Force of Will and 14 non-colored mana sources. What is the probability that we’ll have at least one Force Will in our starting hand? Assume we mulligan all hands with fewer than one colored mana source or fewer than four spells.” (50.4%)
“We’re building an Old School deck that contains four Counterspell, one Mana Drain, and no other spells that cost two blue mana. How many blue mana sources do we need in our deck with 29 mana sources if we wish to cast these spells at least 80% of the time on our second turn?” (15 blue mana sources)
“We’re building Vintage White Eldrazi and we’d like to ensure that we have a two-mana spell to play in our starting hand at least 85% of the time. How many two-mana spells should we play in our deck?” (11 two-mana spells)
“What is the probability that Rich Shay, in the first game of a match, would be able to cast a two-mana spell on the first turn in his Shops deck from the January Power Nine Challenge? Exclude Tolarian Academy and Phyrexian Revoker from your answer.” (73.0%)
“We’re building an Old School aggro deck with four Kird Ape. How many Forests do we need in our deck with 24 mana sources if we wish Kird Ape to be a 2/3 by our second turn at least 90% of the time?” (9 Forests)
Summary
We often pick up bad deck-building habits from our peers as we grow as Magic players, but the use of statistics can help us become better deck-builders without the wasted time of trial-and-error. With these tools and a bit of practice, even the most inexperienced, mathematically-averse among us can quickly answer essentially any deck-building question.
It’s important to remember that there is an inherent subjective nature to deck-building statistics – i.e. what might be acceptable to you may not be acceptable to someone else. Skilled, experienced deck-builders have some developed statistical intuition and, of course, do not need to calculate such statistics all the time. When our intuition fails us, however, calculating statistics becomes even more prudent.
Please let me know if you have any suggestions, questions, or feedback in the comments below!
Thanks for reading,
Mike